| Name of the fund | Parag Parikh Flexi Cap Fund |
| Investment Objective | To seek to generate long-term capital growth from an actively managed portfolio primarily of Equity and Equity Related Securities. Scheme shall invest in Indian equities, foreign equities and related instruments and debt securities. |
| Type of the scheme | An open ended dynamic Equity scheme investing across large cap, mid cap, small cap Stocks. |
| Date of Allotment | May 24, 2013 |
| Name of the Fund Managers | Mr. Rajeev Thakkar - Equity Fund Manager (Since Inception) Mr. Raunak Onkar - Dedicated Fund Manager for Overseas Securities (Since Inception) Mr. Raj Mehta - Debt Fund Manager (Since January 27, 2016) |
| Month End Expense Ratio | Regular Plan: 1.85%* Direct Plan: 0.88%* *Including additional expenses and GST on management fees. Total Expense ratio is as on last business day of the month |
| Benchmark Index | NIFTY 500 (TRI) |
| Additional Benchmark | NIFTY 50 (TRI) |
| Minimum Application Amount | New Purchase: 1,000 Additional Purchase: 1,000 Monthly SIP: 1,000,Quarterly SIP: 3,000 |
Assets Under Management
(AUM) as on July 30, 2021 |
13,186.70 Crores |
Average AUM
for the Month |
12,347.65 Crores |
Net Asset Value (NAV) as
on July 30, 2021 |
|
| Regular Plan: 45.9358 | Direct Plan: 48.4446 |
Entry Load |
Not Applicable |
Exit Load |
2% for redemption within 365 days
1% for redemption between 366 - 730 days Nil for redemption beyond 730 days No exit load will be charged, in case of switch transactions between Regular Plan and Direct Plan of the Scheme for existing as well as prospective investors. |
| Beta | 0.74 |
| Standard Deviation | 18.77% |
| Sharpe Ratio | 1.02 |
| Portfolio Turnover (excl Equity Arbitrage) | 17.89% |
| Portfolio Turnover (incl Equity Arbitrage) | 23.63% |
| - Above figures are annualised. - Risk free rate assumed to be 3.40% (FBIL Overnight MIBOR as on 30th July, 2021) |
|
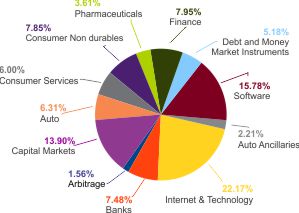
Portfolio Disclosure |
||
Core Equity |
||
Name |
Industry |
% of Net Assets |
Bajaj Holdings & Investment Ltd. |
Finance |
7.95% |
ITC Ltd. |
Consumer Non Durables |
7.85% |
Persistent Systems Ltd. |
Software |
5.32% |
HCL Technologies Ltd. |
Software |
5.16% |
Hero Motocorp Ltd. |
Auto |
5.01% |
Central Depository Services (I) Ltd. |
Capital Markets |
4.85% |
India Energy Exchange Ltd |
Capital Markets |
4.82% |
Mphasis Ltd. |
Software |
3.93% |
Multi Commodity Exchange of India Ltd. |
Capital Markets |
3.03% |
ICICI Bank Ltd. |
Banks |
2.97% |
Axis Bank Ltd. |
Banks |
2.66% |
Balkrishna Industries Ltd. |
Auto Ancillaries |
2.21% |
HDFC Bank Ltd. |
Banks |
1.85% |
Oracle Financial Services Software Ltd. |
Software |
1.37% |
ICRA Ltd. |
Capital Markets |
1.20% |
Cadila Healthcare Ltd. |
Pharmaceuticals |
0.84% |
Sun Pharmaceutical Industries Ltd. |
Pharmaceuticals |
0.81% |
Dr. Reddy's Laboratories Ltd. |
Pharmaceuticals |
0.81% |
Lupin Ltd. |
Pharmaceuticals |
0.77% |
IPCA Laboratories Ltd. |
Pharmaceuticals |
0.38% |
Arbitrage |
||
*Maruti Suzuki India Ltd. |
0.05% |
|
*Tata Steel Ltd. |
0.05% |
|
*Cipla Ltd. |
0.45% |
|
*Tata Motors Ltd. |
1.01% |
|
Total |
65.35% |
|
Overseas Securities, IDRs and ADRs |
||
#Alphabet Inc (Google Class A) |
Internet & Technology |
8.74% |
#Microsoft Corporation |
Internet & Technology |
6.97% |
#Facebook INC |
Internet & Technology |
6.46% |
#AMAZON.COM INC |
Consumer Services |
6.00% |
#Suzuki Motor Corp (ADR)^ |
Auto |
1.30% |
Total |
29.47% |
|
Debt and Money Market Instruments |
||
FDR |
0.55% |
|
TREPS Including Cash & Cash Equivalent and Net Current Asset |
4.63% |
|
Net Assets |
100.00% |
|
# Currency hedge to the extent of approximately 75% of exposure.
* Hedged by offsetting derivative position
^ Traded on US OTC Markets
Lumpsum Investment Performance (Compounded annual returns) |
||||||
Scheme |
Benchmark |
Additional Benchmark |
Value of Investment of Rs. 10,000/- |
|||
| Date | PPFCF (Regular) |
NIFTY 500 (TRI) |
NIFTY 50 (TRI) |
PPFCF (Regular) |
NIFTY 500 (TRI) |
NIFTY 50 (TRI) |
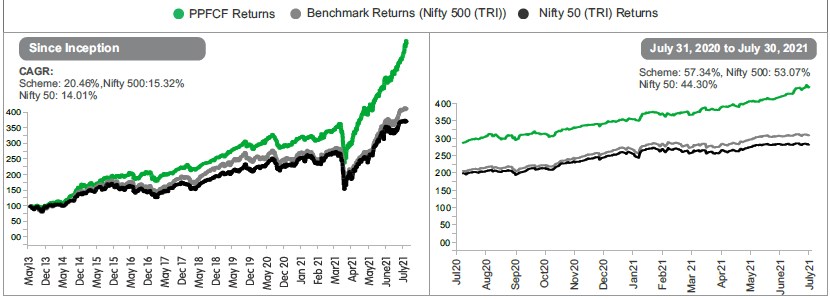
Since Inception (May 24, 2013)* |
20.46% |
15.32% |
14.01% |
45,936 |
32,142 |
29,261 |
July 31, 2020 to July 30, 2021 (Last 1 year) |
57.34% |
53.07% |
44.30% |
15,714 |
15,289 |
14,416 |
July 31, 2018 to July 30, 2021 (Last 3 year) |
22.84% |
13.56% |
12.90% |
18,535 |
14,643 |
14,391 |
July 30, 2016 to July 30, 2021 (Last 5 year) |
20.50% |
14.58% |
14.18% |
25,436 |
19,767 |
19,419 |
*Since inception returns are calculated on Rs. 10 (allotment price)
Note:
Different plans shall have different expense structures.
Scheme returns shown are for regular plan.
Past performance may or may not be sustained in the future.
Greater than 1 year returns are CAGR returns.
Data presented here is upto the last calendar month.
| SIP Investment Performance (Assumption : 10,000/- is invested on the first of every month) | ||||
| Date | Since Inception from June 1, 2013 |
July 31, 2020 to July 30, 2021 (Last 1 year) |
July 31, 2018 to July 30, 2021 (Last 3 year) |
July 30, 2016 to July 30, 2021 (Last 5 year) |
Total Amount Invested |
9,90,000 |
1,20,000 |
3,60,000 |
6,00,000 |
Market value of Investment (Regular Plan) |
24,41,331 |
1,56,638 |
6,01,701 |
11,33,066 |
(Regular Plan) Returns (Annualised) (%) |
21.19% |
61.71% |
36.48% |
25.77% |
Nifty 500 (TRI) Returns (Annualised) (%) |
15.60% |
48.21% |
25.42% |
17.72% |
Nifty 50 (TRI) Returns (Annualised) (%) |
14.54% |
38.15% |
22.18% |
16.88% |
*Since inception returns are calculated on Rs. 10 (allotment price)
Note:
Different plans shall have different expense structures.
Scheme returns shown are for regular plan.
Past performance may or may not be sustained in the future.
Greater than 1 year returns are CAGR returns.
Data presented here is upto the last calendar month.
Source: Internal sources
Parag Parikh Flexi Cap Fund
This Product is suitable for investors who are seeking*
The investment objective of the Scheme is to seek to generate long-term capital growth from an actively managed portfolio primarily of Equity and Equity Related Securities. Scheme shall invest in Indian equities, foreign equities and related instruments and debt securities.
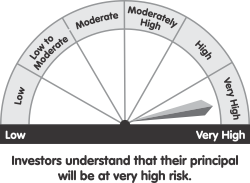
*Investors should consult their financial advisers if in doubt about whether the product is suitable for them.
Mutual Fund investments are subject to market risks, read all scheme related documents carefully.
