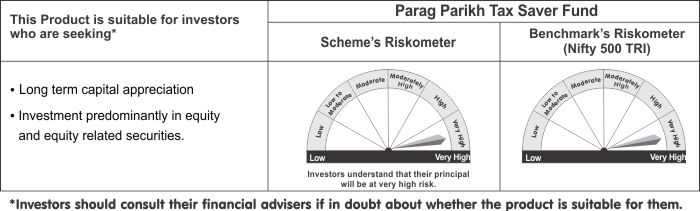
| Name of the fund | Parag Parikh Tax Saver Fund |
| Investment Objective | To seek to generate long-term capital appreciation through a diversified portfolio of equity and equity related instruments |
| Type of the scheme | An open ended equity linked savings scheme with a statutory lock in of 3 years and tax benefit. |
| Date of Allotment | July 24, 2019 |
| Name of the Fund Managers | Mr. Rajeev Thakkar - Equity Fund Manager
(Since Inception) Mr. Raunak Onkar - Co Fund Manager (Since Inception) Mr. Raj Mehta - Debt Fund Manager (Since Inception) |
| Month End Expense Ratio | Regular Plan: 2.29%* Direct Plan: 0.99%* *Including additional expenses and GST on management fees. Total Expense ratio is as on last business day of the month |
| Benchmark Index | NIFTY 500 (TRI) |
| Additional Benchmark | NIFTY 50 (TRI) |
| Minimum Application Amount | New Purchase: 500 and in multiples of 500 Additional Purchase: 500 and in Monthly SIP: 1,000,Quarterly SIP: 3,000 |
Assets Under Management
(AUM) as on Nov. 30, 2021 |
337.02 Crores |
Average AUM
for the Month |
336.34 Crores |
Net Asset Value (NAV) as
on Nov. 30, 2021 |
|
| Regular Plan: 18.1841 | Direct Plan: 18.7193 |
Entry Load |
Not Applicable |
Exit Load |
Not Applicable |
| Portfolio Turnover | 5.05% |
| - Above figures are annualised. - Since the fund has not completed 3 years, other quantitative indicators are not shown as per AMFI Best Practice Guidelines. |
|
Core Equity |
||
Name |
Industry |
% of Net Assets |
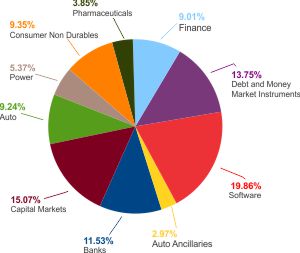
| Bajaj Holdings & Investment Ltd. | Finance | 9.01% |
| ITC Ltd. | Consumer Non Durables | 7.24% |
| Indian Energy Exchange Ltd. | Capital Markets | 6.47% |
| Power Grid Corporation of India Ltd. | Power | 5.37% |
| Tata Consultancy Services Ltd. | Software | 5.03% |
| HCL Technologies Ltd. | Software | 4.84% |
| Maruti Suzuki India Ltd. | Auto | 4.78% |
| ICICI Bank Ltd. | Banks | 4.74% |
| Wipro Ltd. | Software | 4.69% |
| Axis Bank Ltd. | Banks | 4.58% |
| Hero MotoCorp Ltd. | Auto | 4.46% |
| Central Depository Services (I) Ltd. | Capital Markets | 3.50% |
| Balkrishna Industries Ltd. | Auto Ancillaries | 2.97% |
| Persistent Systems Ltd. | Software | 2.58% |
| Multi Commodity Exchange of India Ltd. | Capital Markets | 2.31% |
| HDFC Bank Ltd. | Banks | 2.21% |
| CCL Products (India) Ltd. | Consumer Non Durables | 2.11% |
| ICRA Ltd. | Capital Markets | 1.78% |
| Mphasis Ltd. | Software | 1.78% |
| Motilal Oswal Financial Services Ltd. | Capital Markets | 1.01% |
| Dr. Reddy's Laboratories Ltd. | Pharmaceuticals | 0.97% |
| Oracle Financial Services Software Ltd. | Software | 0.94% |
| Cadila Healthcare Ltd. | Pharmaceuticals | 0.94% |
| Sun Pharmaceutical Industries Ltd. | Pharmaceuticals | 0.93% |
| Lupin Ltd. | Pharmaceuticals | 0.53% |
| IPCA Laboratories Ltd. | Pharmaceuticals | 0.48% |
Total |
86.25% |
|
Debt and Money Market Instruments |
||
TREPS Including Cash & Cash Equivalent and Net Current Asset |
Debt and Money Market Instruments |
13.75% |
Net Assets |
100.00% |
|
Lumpsum Investment Performance (Compounded annual returns) |
||||||
Scheme |
Benchmark |
Additional Benchmark |
Value of Investment of Rs. 10,000/- |
|||
| Date | PPTSF (Regular) |
NIFTY 500 (TRI) |
NIFTY 50 (TRI) |
PPTSF (Regular) |
NIFTY 500 (TRI) |
NIFTY 50 (TRI) |
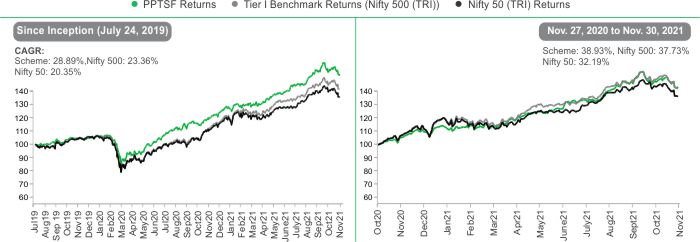
Since Inception (24 July, 2019)* |
28.89% |
23.36% |
20.35% |
18,184 |
16,398 |
15,473 |
Nov. 27, 2020 to Nov. 30 2021 (Last 1 year) |
38.93% |
37.73% |
32.19% |
13,930 |
13,809 |
13,249 |
*Since inception returns are calculated on Rs. 10 (allotment price)
Note:
Different plans shall have different expense structures.
Scheme returns shown are for regular plan.
Past performance may or may not be sustained in the future.
Greater than 1 year returns are CAGR returns.
Data presented here is upto the last calendar month.
| SIP Investment Performance (Assumption : 10,000/- is invested on the first of every month) | ||
| Date | Since Inception from July 24, 2019 |
November 27, 2020 to November 30 2021 (Last 1 year) |
Total Amount Invested |
2,90,000 |
1,20,000 |
Market value of Investment (Regular Plan) |
4,37,552 |
1,40,538 |
(Regular Plan) Returns (Annualised) (%) |
36.57% |
33.23% |
Nifty 500 (TRI) Returns (Annualised) (%) |
33.05% |
27.15% |
Nifty 50 (TRI) Returns (Annualised) (%) |
29.10% |
22.30% |
*Since inception returns are calculated on Rs. 10 (allotment price)
Note:
Different plans shall have different expense structures.
Scheme returns shown are for regular plan.
Past performance may or may not be sustained in the future.
Greater than 1 year returns are CAGR returns.
Data presented here is upto the last calendar month.
Total number of units held in Parag Parikh Tax Saver Fund as per SEBI Circular
relating to Alignment of interest of Key Employees ('Designated Employees') of
Asset Management Companies ('AMCs') with the unitholders of the Mutual Fund
Schemes. (dated April 28, 2021 read with September 20, 2021) as at 30-11-2021
Scheme |
Units |
AUM (in Rs.) |
Parag Parikh Tax Saver Fund - Direct Plan |
1,541.87 |
28,861.15 |
Mutual Fund investments are subject to market risks, read all scheme related documents carefully.
