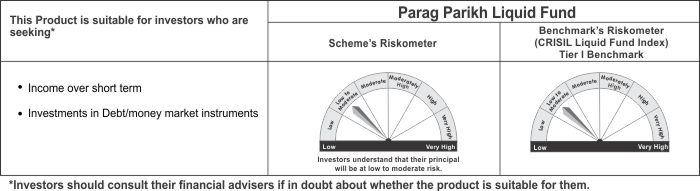
| Name of the fund | Parag Parikh Liquid Fund |
| Investment Objective | To deliver reasonable market related returns with lower risk and high liquidity through judicious investments in money market and debt instruments. (Non Guaranteed) |
| Type of the scheme | An Open-ended Liquid Scheme |
| Date of Allotment | May 11, 2018 |
| Name of the Fund Managers | Mr. Raj Mehta -
(Since Inception) |
| Month End Expense Ratio | Regular Plan: 0.26%* Direct Plan: 0.16%* *Including additional expenses and GST on management fees. Total Expense ratio is as on last business day of the month |
| Benchmark Index | CRISIL Liquid fund index |
| Additional Benchmark | CRISIL 1 Year T-Bill index |
| Minimum Application Amount | New Purchase: 5,000 Additional Purchase: 1,000 Monthly SIP: 1,000 Quarterly SIP: 3,000/- |
Assets Under Management
(AUM) as on Nov. 30, 2021 |
1,486.42 Crores |
Average AUM
for the Month |
1,505.44 Crores |
Net Asset Value (NAV) |
||
| Plan | Direct |
Regular |
| Growth | 1177.9009 |
1173.5862 |
| Daily Reinvestment of Income Distribution cum capital withdrawal option |
1000.5404 |
1000.5404 |
| Weekly Reinvestment of Income Distribution cum capital withdrawal option | 1001.1030 |
1001.1004 |
| Monthly Income Distribution cum capital withdrawal option |
1003.1032 |
1003.1005 |
Dividend History - Monthly Income Distribution cum capital Withdrawal option |
|||||||||
| Record date/ Payout Date |
Direct |
Regular |
Regular |
Direct |
Regular |
Direct |
|||
Retail |
Corporate |
Retail |
Corporate |
Face Value |
NAV per Unit (Ex IDCW) |
NAV per Unit (Ex IDCW) |
NAV per Unit (Cum IDCW) |
NAV per Unit (Cum IDCW) |
|
| 29th Nov. 2021 | 3.1778 |
3.1778 |
3.0806 |
3.0806 |
1,000 |
1,003.0000 |
1,003.0000 |
1,006.0806 |
1,006.1778 |
| 25th Oct. 2021 | 2.4257 |
2.4257 |
2.3485 |
2.3485 |
1,000 |
1,003.0000 |
1,003.0000 |
1,005.3485 |
1,005.4257 |
| 27th Sept. 2021 | 2.2916 |
2.2916 |
2.2147 |
2.2147 |
1,000 |
1,003.0000 |
1,003.0000 |
1,005.2147 |
1,005.2916 |
Entry Load |
Not Applicable |
Exit Load |
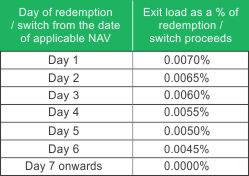 |
| * For purpose of levying exit load, if subscription (application & funds) is received within cut-off time on a day, Day 1 shall be considered to be the same day, else the day after the date of allotment of units shall be considered as Day 1. | |
| Average Maturity (Days) | 40.56 |
| Modified duration (Years) | 0.1049 |
| Yield to Maturity | 3.4129% |
| Macaulay Duration (Years) | 0.1085 |
| * Computed on the invested amount | |
Source: Internal sources
Source: Internal sources
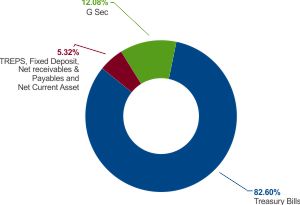
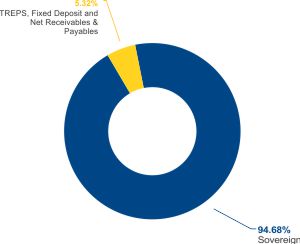
Portfolio Disclosure |
||
Debt and Money Market Instruments |
||
Name |
Rating |
% of Net Assets |
a) Treasury Bills |
||
91 DAY T-BILL 13-Jan-2022 |
Sovereign |
8.38% |
91 DAY T-BILL 20-Jan-2022 |
Sovereign |
8.37% |
91 DAY T-BILL 02-Feb-2022 |
Sovereign |
8.36% |
91 DAY T-BILL 24-Feb-2022 |
Sovereign |
8.34% |
91 DAY T-BILL 02-Dec-2021 |
Sovereign |
6.73% |
182 DAY T-BILL 09-Dec-2021 |
Sovereign |
6.72% |
182 DAY T-BILL 16-Dec-2021 |
Sovereign |
6.72% |
91 DAY T-BILL 23-Dec-2021 |
Sovereign |
6.71% |
182 DAY T-BILL 30-Dec-2021 |
Sovereign |
6.71% |
91 DAY T-BILL 06-Jan-2022 |
Sovereign |
6.71% |
182 DAY T-BILL 23-Dec-2021 |
Sovereign |
3.36% |
182 DAY T-BILL 02-Dec-2021 |
Sovereign |
2.69% |
b) Government Securities |
||
8.79% Government of India 08-Nov-2021 |
Sovereign |
6.79% |
| c) State Government Securities | ||
8.70% State Government of Kerala 25-Jan-2022 |
Sovereign |
7.12% |
8.72% State Government of Bihar 25-Jan-2022 |
Sovereign |
0.68% |
| d) Certificate of Deposit | ||
NABARD 08-Feb-2022 |
A1+ |
0.67% |
d) TREPS and Other Receivables and Payables |
||
TREPS Including Net Receivables/Payables and Net Current Asset |
4.37% |
|
e) Fixed Deposits |
||
FDR |
0.57% |
|
Net Assets |
100.00% |
|
Lumpsum Investment Performance (Compounded annual returns) |
||||||
Scheme |
Benchmark |
Additional Benchmark |
Value of Investment of Rs. 10,000/- |
|||
| Date | PPLF (Regular) |
CRISIL Liquid Fund Index |
CRISIL 1 year T-bill Index |
PPLF (Regular) |
CRISIL Liquid Fund Index |
CRISIL 1 year T-bill Index |
| Since Inception (11 May, 2018)* | 4.60% |
5.54% |
5.97% |
11,736 |
12,115 |
12,291 |
| November 23, 2021 to November 30, 2021 (Last 7 Days) |
3.51% |
3.85% |
2.96% |
10,007 |
10,007 |
10,006 |
| November 15, 2021 to November 30, 2021 (Last 15 days) |
3.23% |
3.69% |
3.13% |
10,013 |
10,015 |
10,013 |
| October 31, 2021 to November 30, 2021 (Last 1 Month) |
3.35% |
3.97% |
3.76% |
10,028 |
10,033 |
10,031 |
| November 30, 2020 to November 30, 2021 (Last 1 year) |
3.06% |
3.57% |
3.49% |
10,306 |
10,357 |
10,349 |
| November 30, 2018 to November 30, 2021 (Last 3 year) |
4.27% |
5.13% |
5.82% |
11,337 |
11,621 |
11,850 |
*Since inception returns are calculated on Rs. 1000 (allotment price)
Note:
Different plans shall have different expense structures.
Scheme returns shown are for regular plan.
Past performance may or may not be sustained in the future.
Greater than 1 year returns are CAGR returns.
Data presented here is upto the last calendar month.
Less than 1 year returns are simple annualised returns.
Total number of units held in Parag Parikh Liquid Fund as per SEBI Circular relating to Alignment of interest of Key Employees ('Designated Employees') of Asset Management Companies ('AMCs') with the unitholders of the Mutual Fund Schemes. (dated April 28, 2021 read with September 20, 2021) as at 30-11-2021
Scheme |
Units |
AUM (in Rs.) |
Parag Parikh Liquid Fund Direct Plan Growth |
89.52 |
1,05,440.97 |
Mutual Fund investments are subject to market risks, read all scheme related documents carefully.
