| Name of the fund | Parag Parikh Liquid Fund |
| Investment Objective | To deliver reasonable market related returns with lower risk and high liquidity through judicious investments in money market and debt instruments. (Non Guaranteed) |
| Type of the scheme | An Open-ended Liquid Scheme |
| Date of Allotment | May 11, 2018 |
| Name of the Fund Managers | Mr. Raj Mehta - (Since Inception) |
| Month End Expense Ratio |
Regular Plan: 0.26%* Direct Plan: 0.16%* *Including additional expenses and GST on management fees. Total Expense ratio is as on last business day of the month |
| Tier 1 Benchmark Index | CRISIL Liquid fund index |
| Additional Benchmark | CRISIL 1 Year T-Bill index |
| Minimum Application Amount |
New Purchase: ₹ 5,000 Additional Purchase: ₹ 1,000 Monthly SIP: ₹ 1,000 Quarterly SIP: ₹ 3,000/- |
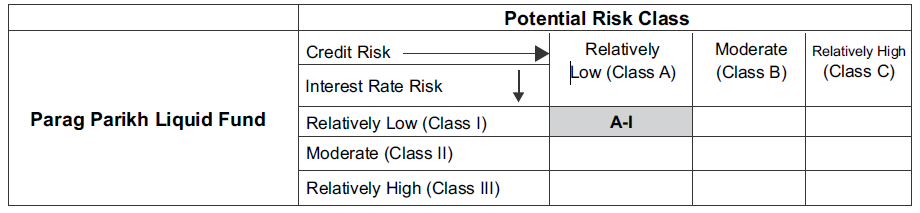
Parag Parikh Liquid Fund
An Open ended Liquid scheme. A Relatively Low Interest Rate Risk and Relatively low Credit Risk.
Factsheet - February 2022
| Assets Under Management (AUM) as onFeb. 28, 2022 | ₹ 1,413.99 Crores |
| Average AUM for the Month | ₹ 1,484.46 Crores |
| Plan | Direct | Regular |
|---|---|---|
| Growth | 1187.8692 | 1183.2279 |
| Daily Reinvestment of Income Distribution cum capital withdrawal option | 1000.5404 | 1000.5404 |
| Weekly Reinvestment of Income Distribution cum capital withdrawal option | 1001.0000 | 1001.0000 |
| Monthly Income Distribution cum capital withdrawal option | 1003.0000 | 1003.0000 |
Dividend History - Monthly Income Distribution cum capital Withdrawal option |
|||||||||
| Record date/ Payout Date | Direct |
Regular |
Regular |
Direct |
Regular |
Direct |
|||
|---|---|---|---|---|---|---|---|---|---|
Retail |
Corporate |
Retail |
Corporate |
Face Value |
NAV per Unit (Ex IDCW) |
NAV per Unit (Ex IDCW) |
NAV per Unit (Cum IDCW) |
NAV per Unit (Cum IDCW) |
|
| 28th Feb. 2022 | 2.8093 |
2.8093 |
2.7340 |
2.7340 |
1,000 |
1,003 |
1,003 |
1,005.7340 |
1,005.8093 |
| 31st Jan. 2022 | 3.2383 |
3.2383 |
3.1426 |
3.1426 |
1,000 |
1,003 |
1,003 |
1,006.1426 |
1,006.2383 |
| 27th Dec. 2021 | 2.5203 |
2.5203 |
2.4428 |
2.4428 |
1,000 |
1,003 |
1,003 |
1,005.4428 |
1,005.5203 |
| Entry Load | Not Applicable |
| Exit Load | 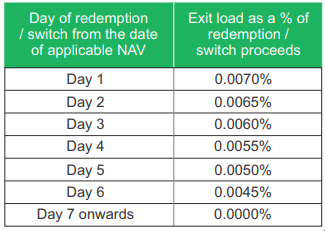 |
| * For purpose of levying exit load, if subscription (application & funds) is received within cut-off time on a day, Day 1 shall be considered to be the same day, else the day after the date of allotment of units shall be considered as Day 1. | |
| Average Maturity (Days) | 42.79 |
| Modified duration (Years) | 0.1110 |
| Yield to Maturity | 3.5420% |
| Macaulay Duration (Years) | 0.1147 |
| * Computed on the invested amount | |
Source: Internal sources
Source: Internal sources
Debt and Money Market Instruments |
||
Name |
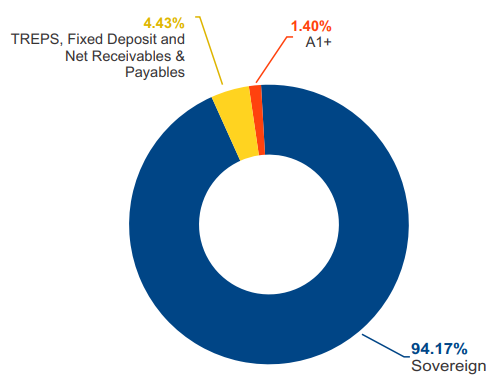
Rating |
% of Net Assets |
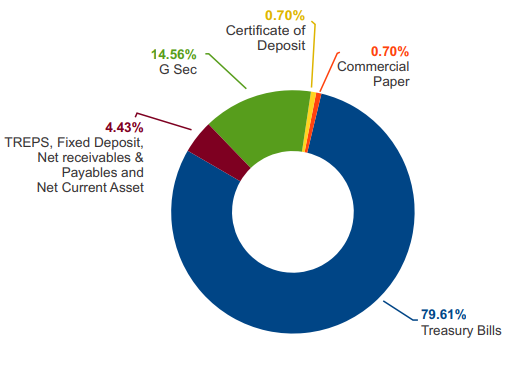
a) Treasury Bills |
||
91 DAY T-BILL 02-Feb-2022 |
Sovereign |
8.23% |
91 DAY T-BILL 24-Feb-2022 |
Sovereign |
8.21% |
91 DAY T-BILL 03-Mar-2022 |
Sovereign |
8.20% |
91 DAY T-BILL 17-Mar-2022 |
Sovereign |
8.19% |
364 DAY T-BILL 07-Apr-2022 |
Sovereign |
8.17% |
91 DAY T-BILL 21-Apr-2022 |
Sovereign |
8.16% |
91 DAY T-BILL 10-Mar-2022 |
Sovereign |
7.54% |
91 DAY T-BILL 24-Mar-2022 |
Sovereign |
4.91% |
91 DAY T-BILL 28-Apr-2022 |
Sovereign |
4.24% |
182 DAY T-BILL 07-Apr-2022 |
Sovereign |
1.63% |
b) Government Securities |
||
5.09% Government of India 13-APR-2022 |
Sovereign |
7.92% |
8.20% Government of India 15-FEB-2022 |
Sovereign |
6.59% |
| c) Commercial Paper | Housing Development Finance Corporation Ltd. 24-Feb-2022 |
A1+ |
0.66% |
| d) Certificate of Deposit | NABARD 08-Feb-2022 |
A1+ |
0.66% |
| e) TREPS and Other Receivables and Payables | TREPS Including Net Receivables/Payables and Net Current Asset |
16.13% |
f) Fixed Deposits |
||
FDR |
0.56% |
|
Net Assets |
100.00% |
|
Lumpsum Investment Performance (Compounded annual returns) |
||||||
Scheme |
Tier I Benchmark |
Additional Benchmark |
Value of Investment of Rs. 10,000/- |
|||
| Date | PPLF (Regular) |
CRISIL Liquid Fund Index |
CRISIL 1 year T-bill Index |
PPLF (Regular) |
CRISIL Liquid Fund Index |
CRISIL 1 year T-bill Index |
| Since Inception (11 May, 2018)* | 4.52% |
5.42% |
5.82% |
11,832 |
12,226 |
12,401 |
| February 21, 2022 to February 28, 2022 (Last 7 Days) | 3.35% |
3.62% |
0.98% |
10,006 |
10,007 |
10,002 |
| February 13, 2022 to February 28, 2022 (Last 15 days) | 3.40% |
3.84% |
3.43% |
10,014 |
10,016 |
10,014 |
| January 31, 2022 to February 28, 2022 (Last 1 Month) | 3.55% |
3.88% |
6.15% |
10,027 |
10,030 |
10,047 |
| February 28, 2021 to February 28, 2022 (Last 1 year) | 3.18% |
3.65% |
3.65% |
10,318 |
10,365 |
10,365 |
| February 28, 2019 to February 28, 2022 (Last 3 year) | 4.02% |
4.82% |
5.36% |
11,256 |
11,518 |
11,697 |
*Since inception returns are calculated on Rs. 1000 (allotment price)
Note:
Different plans shall have different expense structures.
Scheme returns shown are for regular plan.
Past performance may or may not be sustained in the future.
Greater than 1 year returns are CAGR returns.
Data presented here is upto the last calendar month.
Less than 1 year returns are simple annualised returns.
Total number of units held in